Using the Space ROS Dashboard
Static analysis is a critical step in the formal verification required for safety-critical systems. The Space ROS Dashboard is a tool for aggregating and tracking issues discovered through static analysis. These issues are represented in SARIF format, which is a format for representing issues found by static analysis tools.
The main features of the Space ROS Dashboard are as follows:
Track issues reported by static analysis tooling, including annotating them with links to bug reports in your dispositioning service of choice
Compare issues across multiple builds
View a burn-down chart of issues over time
This how-to guide will walk you through the main features of the Space ROS Dashboard.
Prerequisites
In order to use the Space ROS Dashboard, you will have to install Visual Studio Code and the Space ROS Dashboard extension.
You will also need to have SARIF data to view, which you can obtain through running colcon build and then colcon test.
Note, that you will have to enable exporting of the compile commands, which you can do by running colcon build with --cmake-args -DCMAKE_EXPORT_COMPILE_COMMANDS=ON or by adding set(COLCON_EXPORT_COMPILE_COMMANDS ON) in the package’s CMakeLists.txt file.
Optionally, you can use Microsoft’s Dev Containers Extension to use the Space ROS Dashboard with Visual Studio Code inside of a Docker container.
Dispositioning issues
Once you have the Space ROS Dashboard extension installed, you can open a SARIF file (found in spaceros_ws/build/<package>/test_results) in Visual Studio Code and the Dashboard will automatically open.
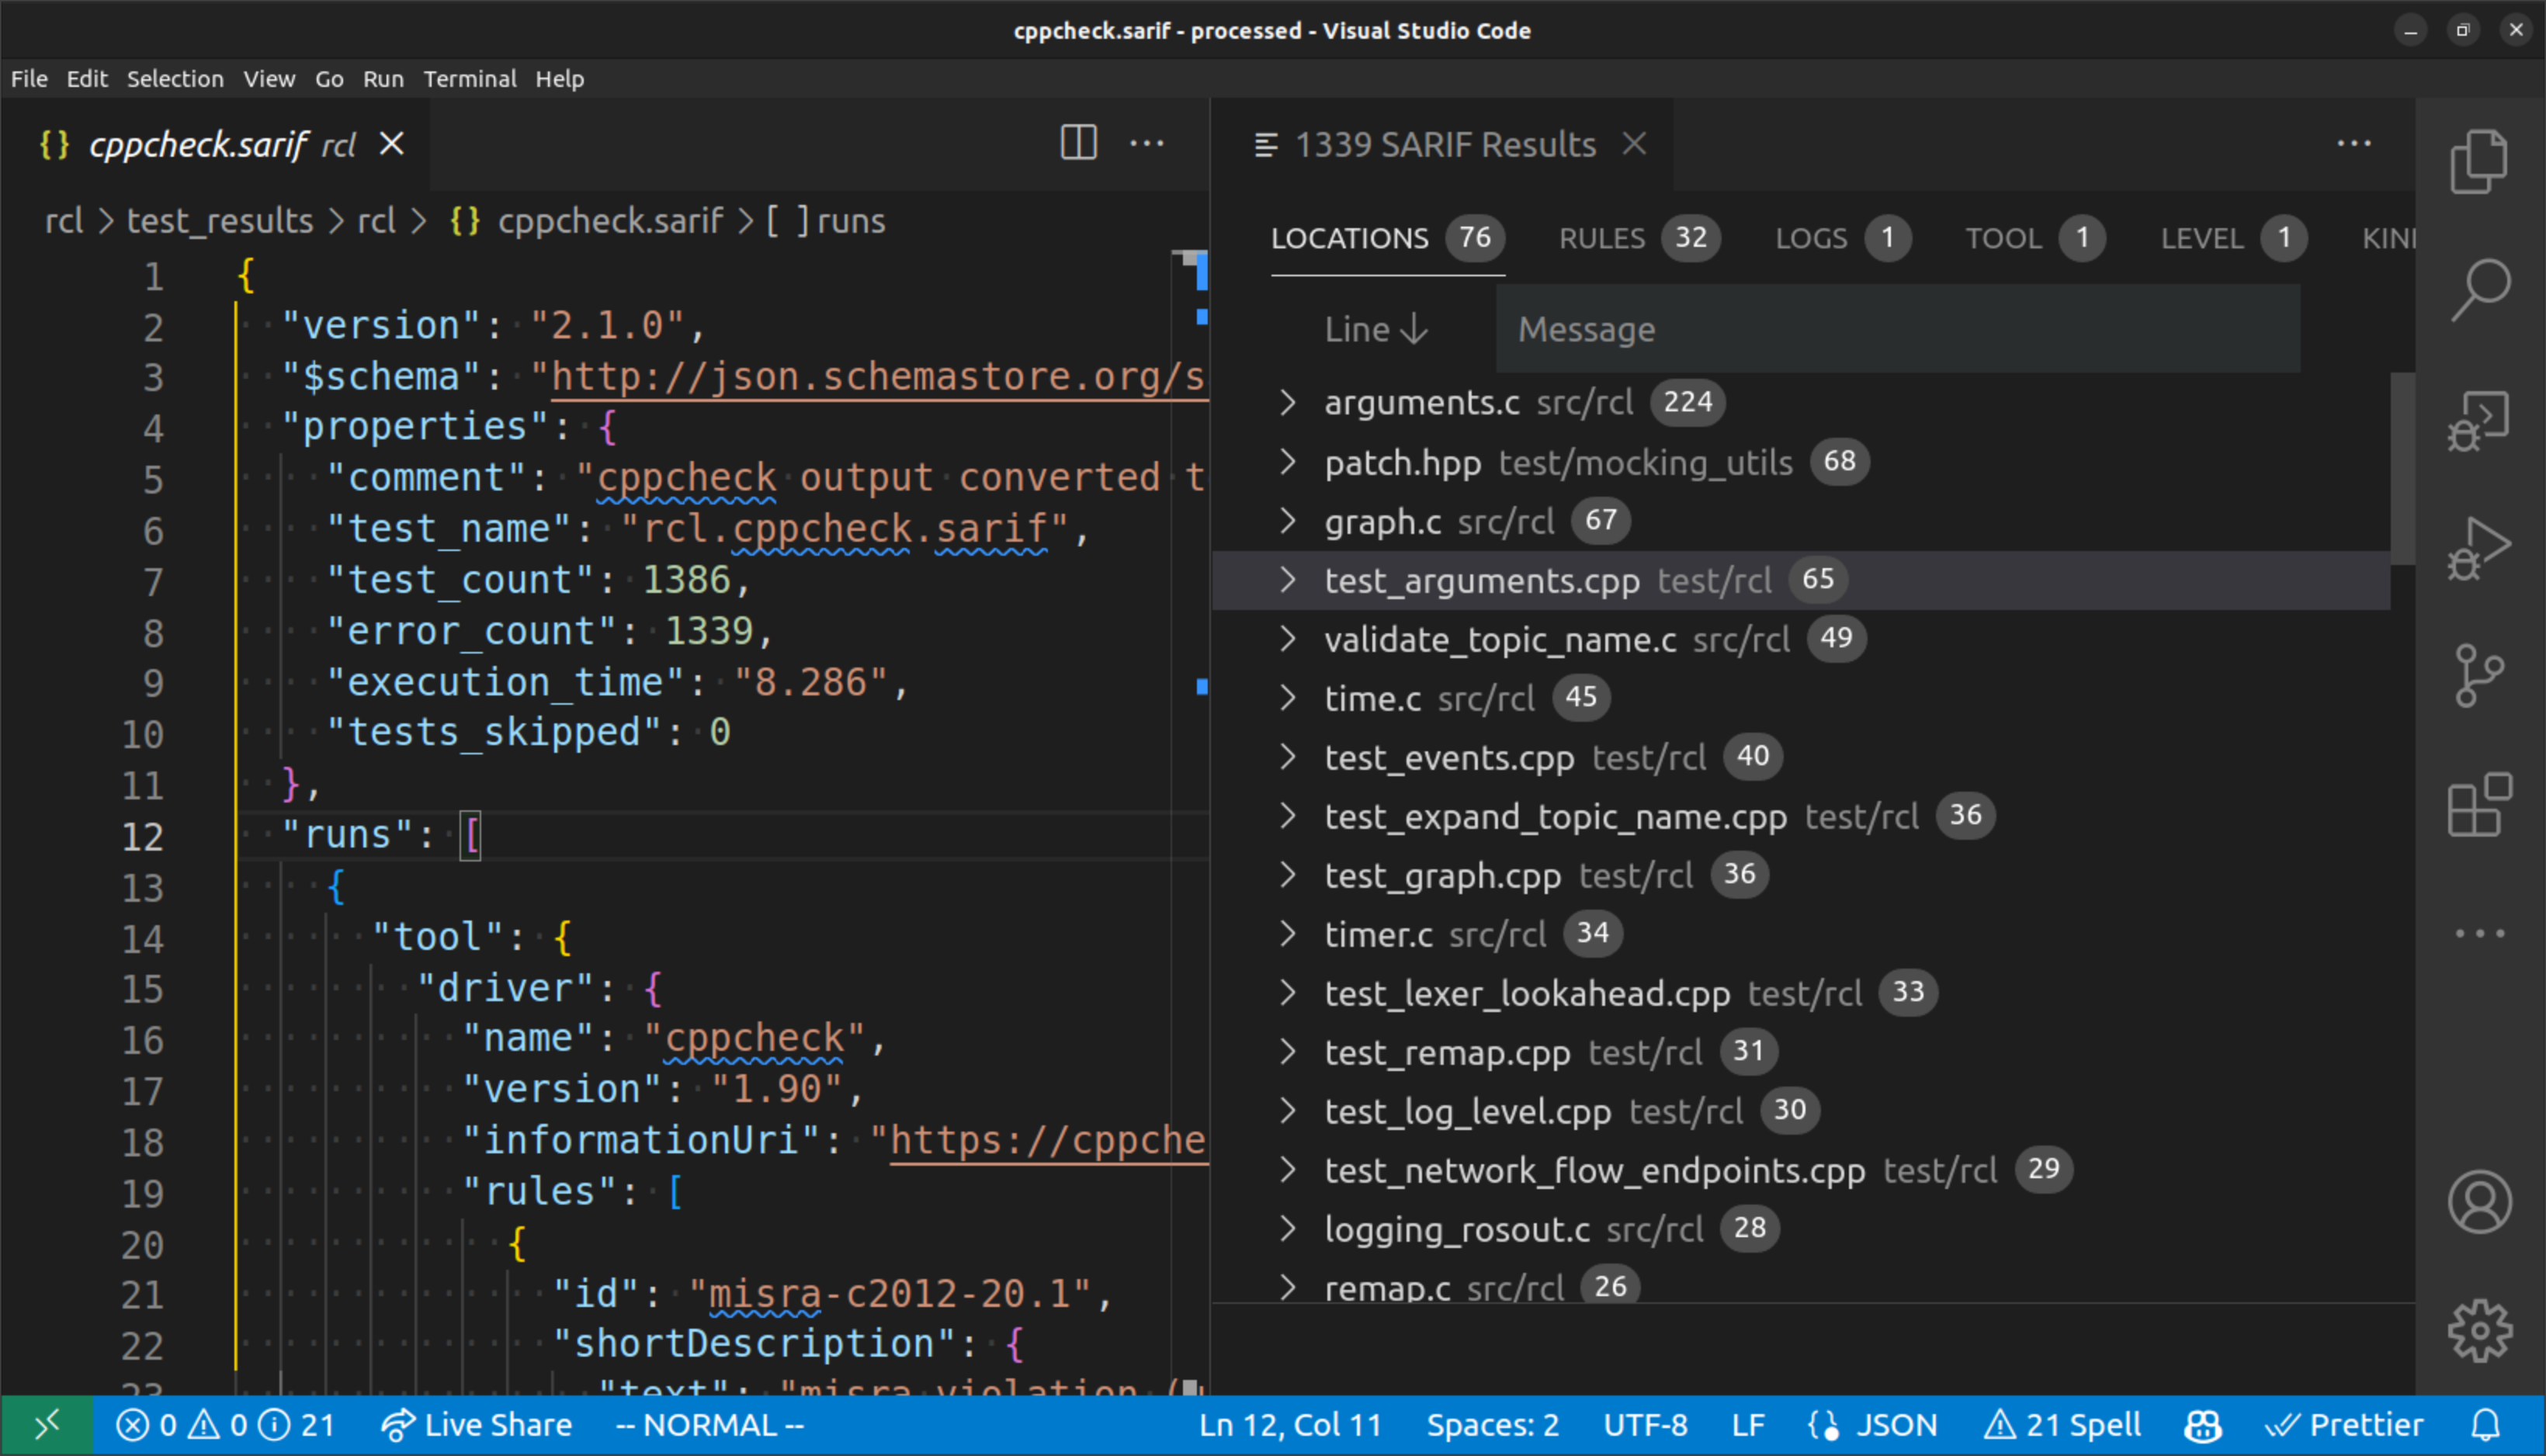
An example of what the Space ROS Dashboard looks like when opened with a SARIF file
From there, you are able to explore issues by their location, rules, tools, and more. When you click an issue, you will see more information for that issue in the bottom right panel.
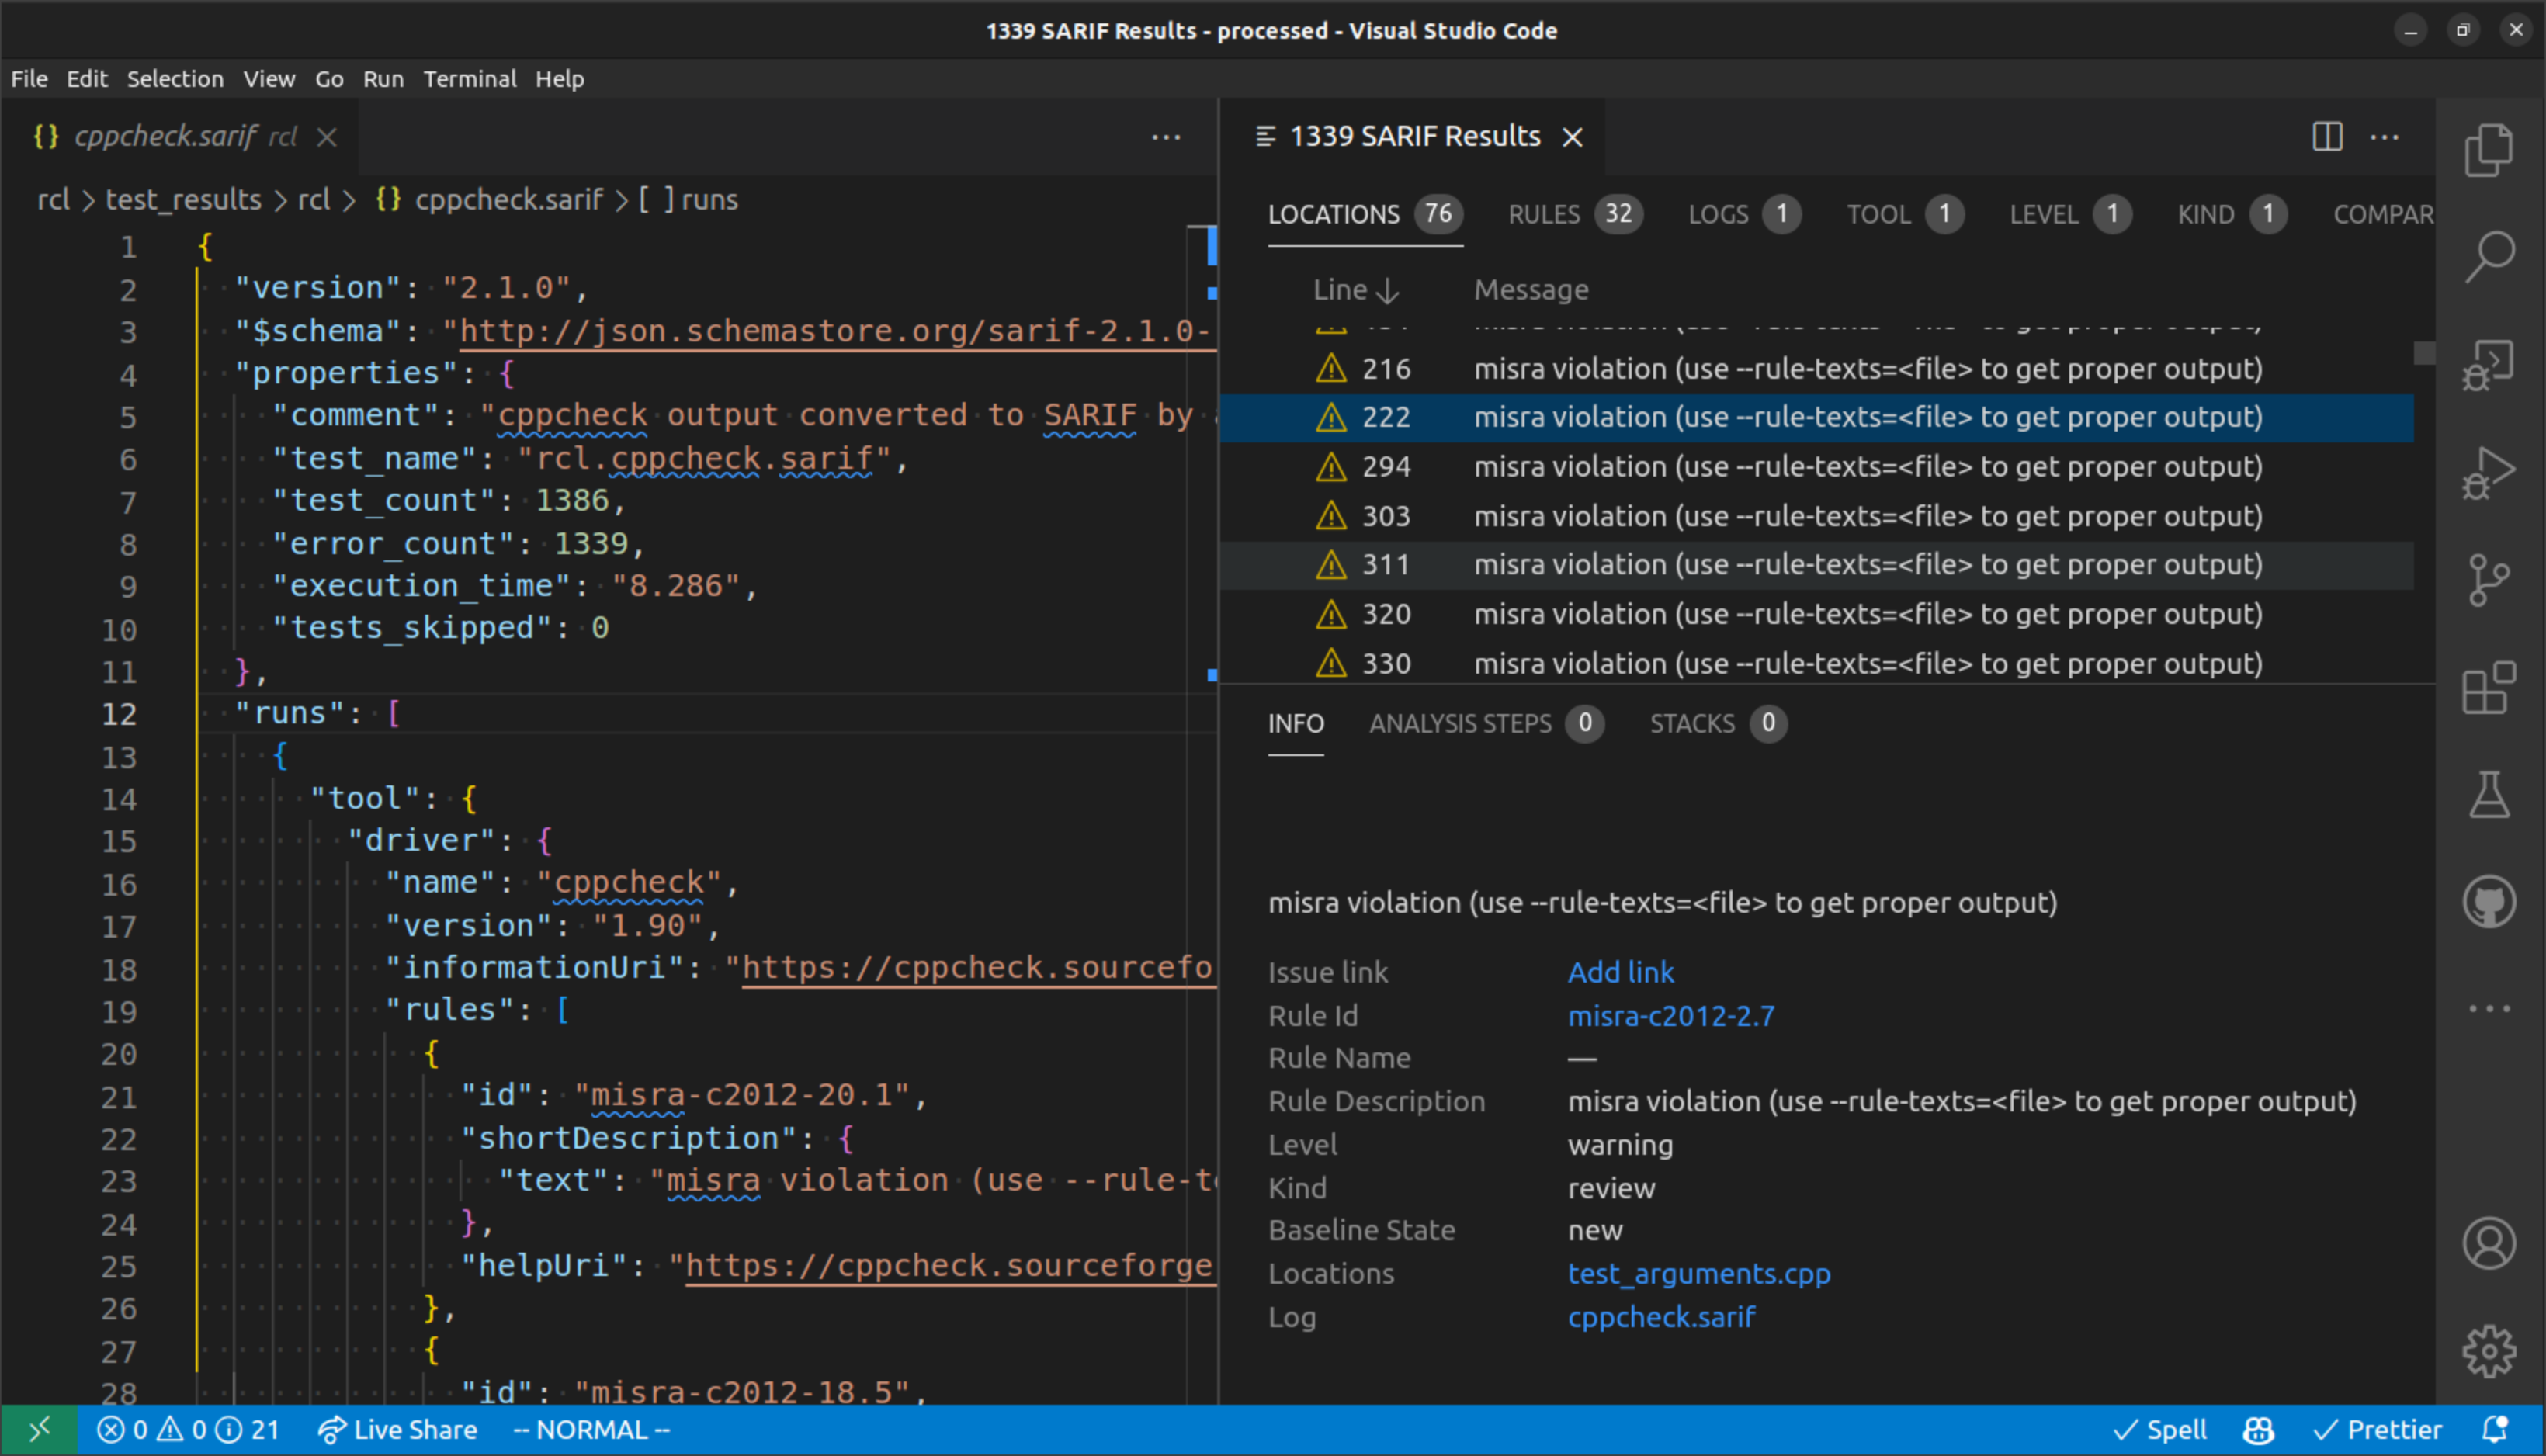
The bottom right panel shows you more details about the selected issue.
You are also able to add an annotation to the issue to record where that issue will be tracked, for example, on Github or Bitbucket.
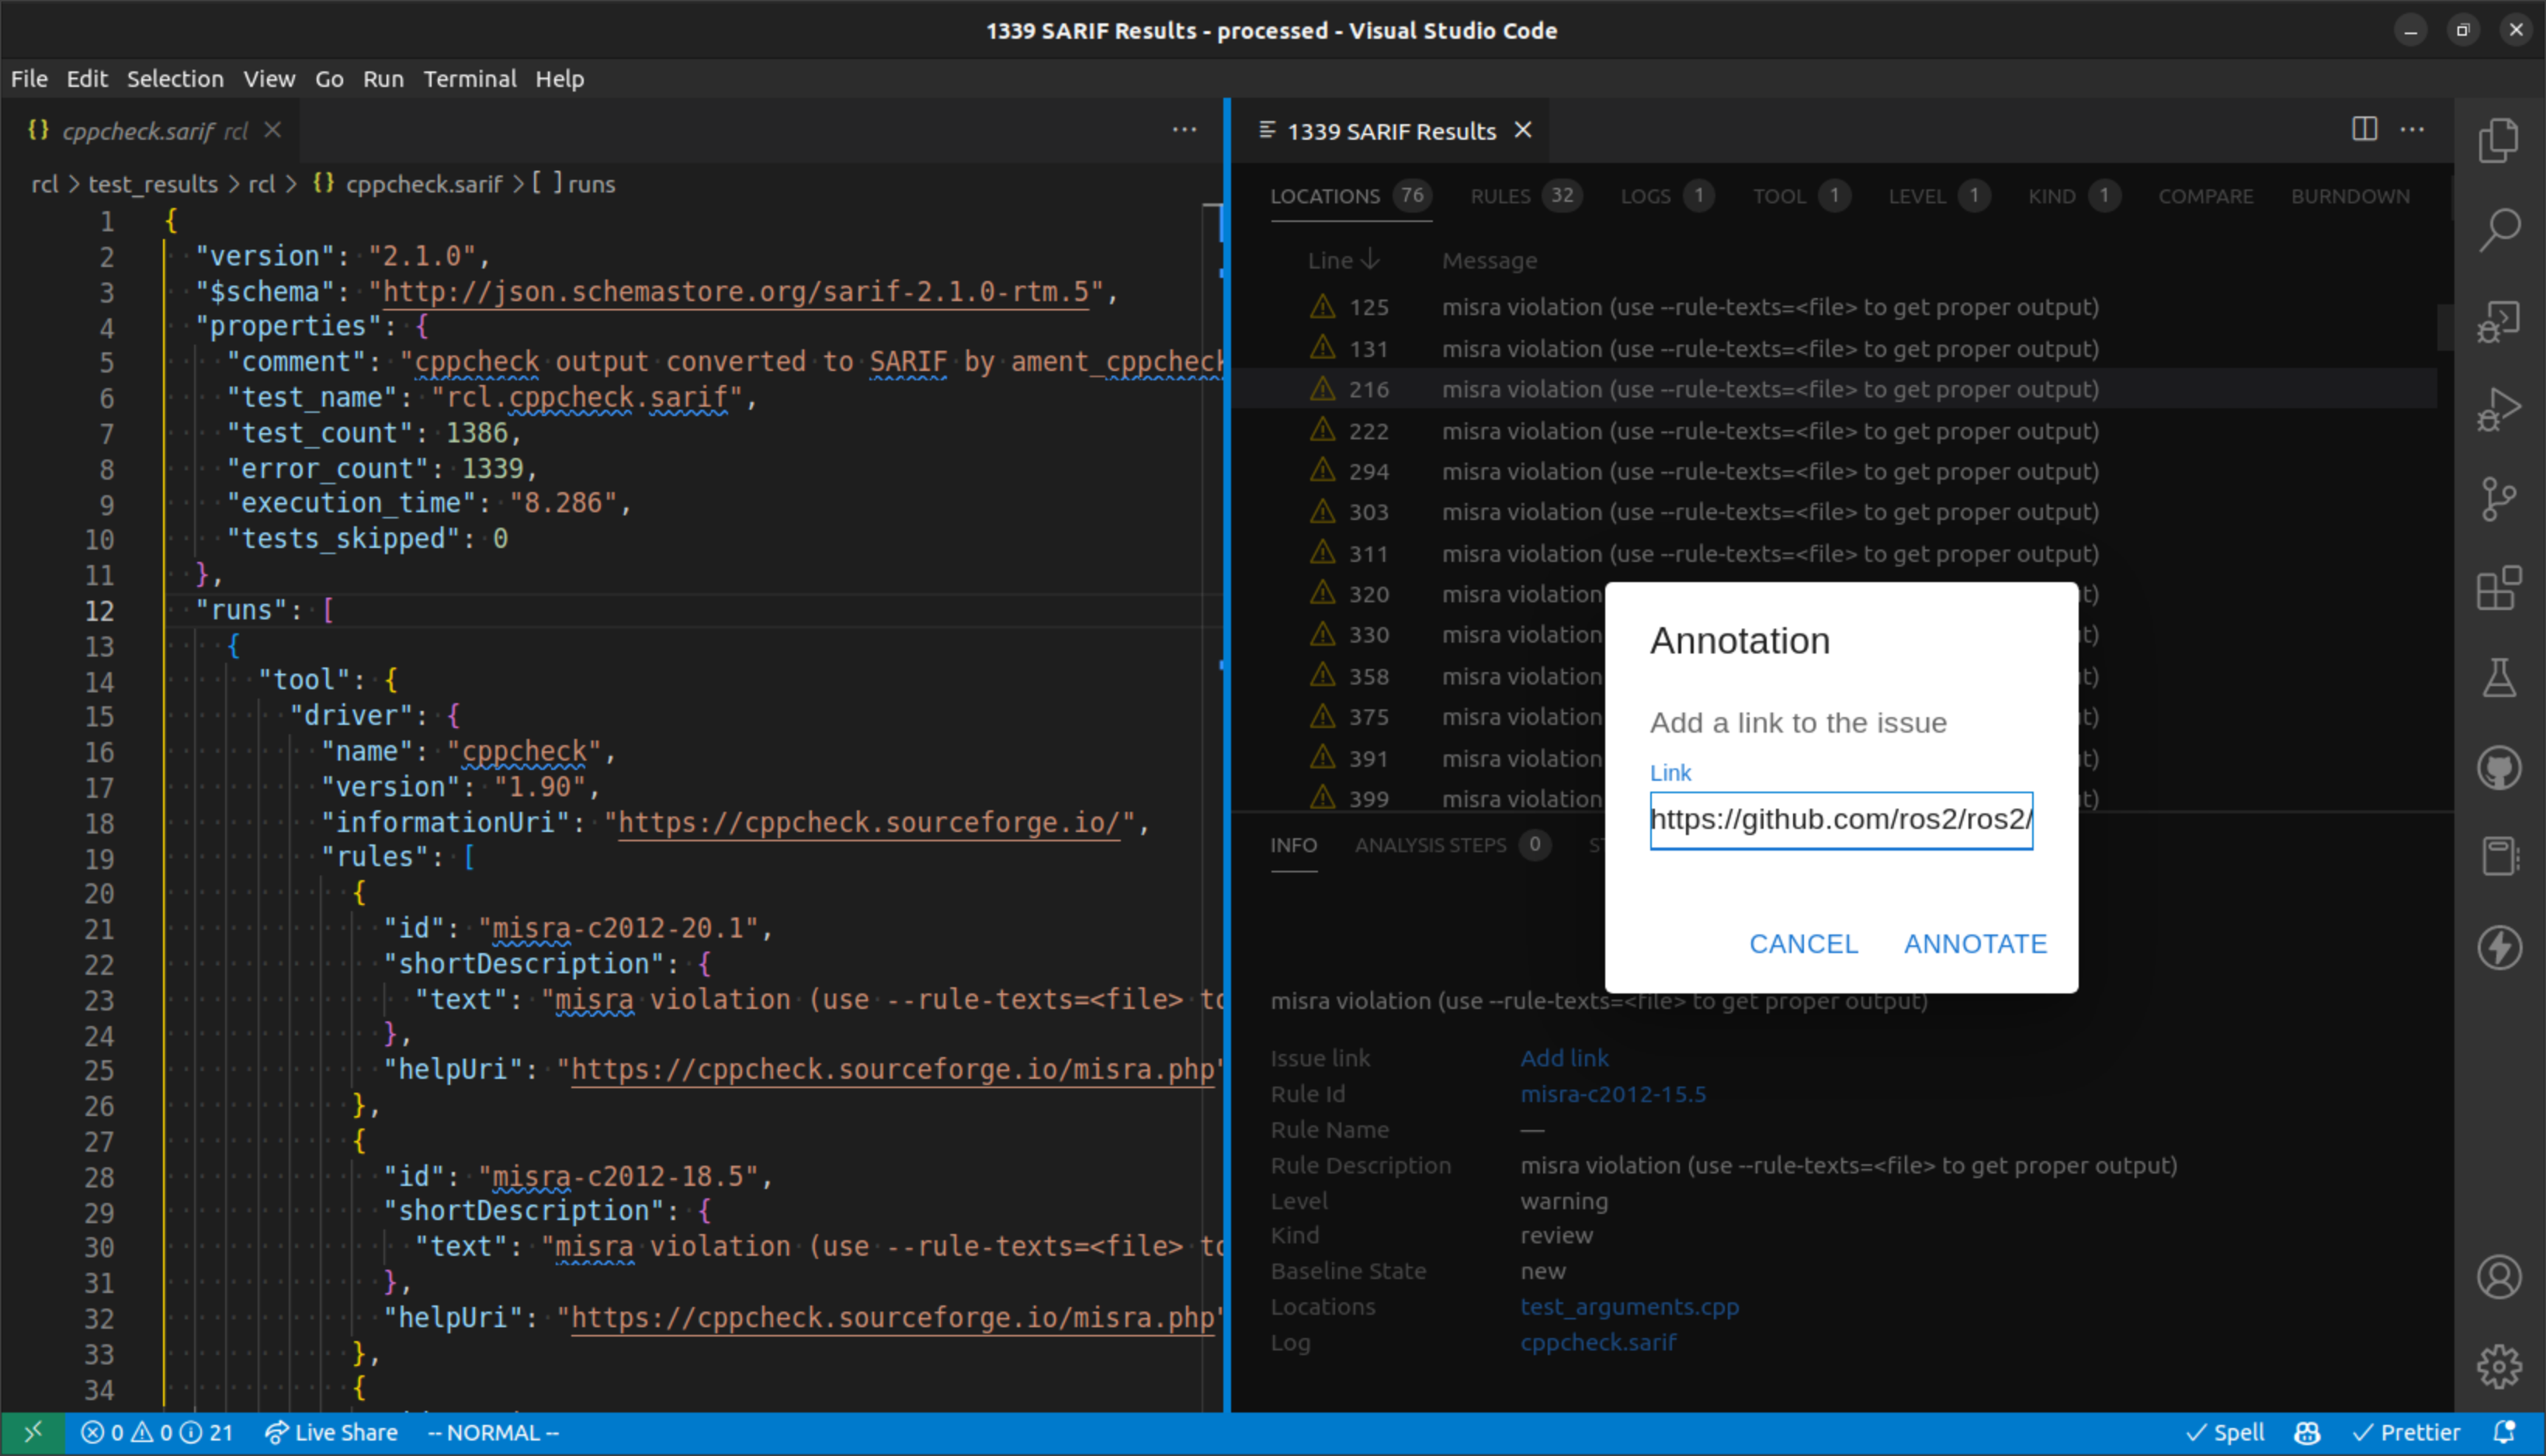
A popover is created to add an annotation to the issue.
Note
Saving annotations is a work-in-progress and may not be available in the current release.
Saving annotations is not automatic. In order to save your annotations, you will need to save click the “Upload annotations” button in the top right of the panel.
Comparing issues across builds
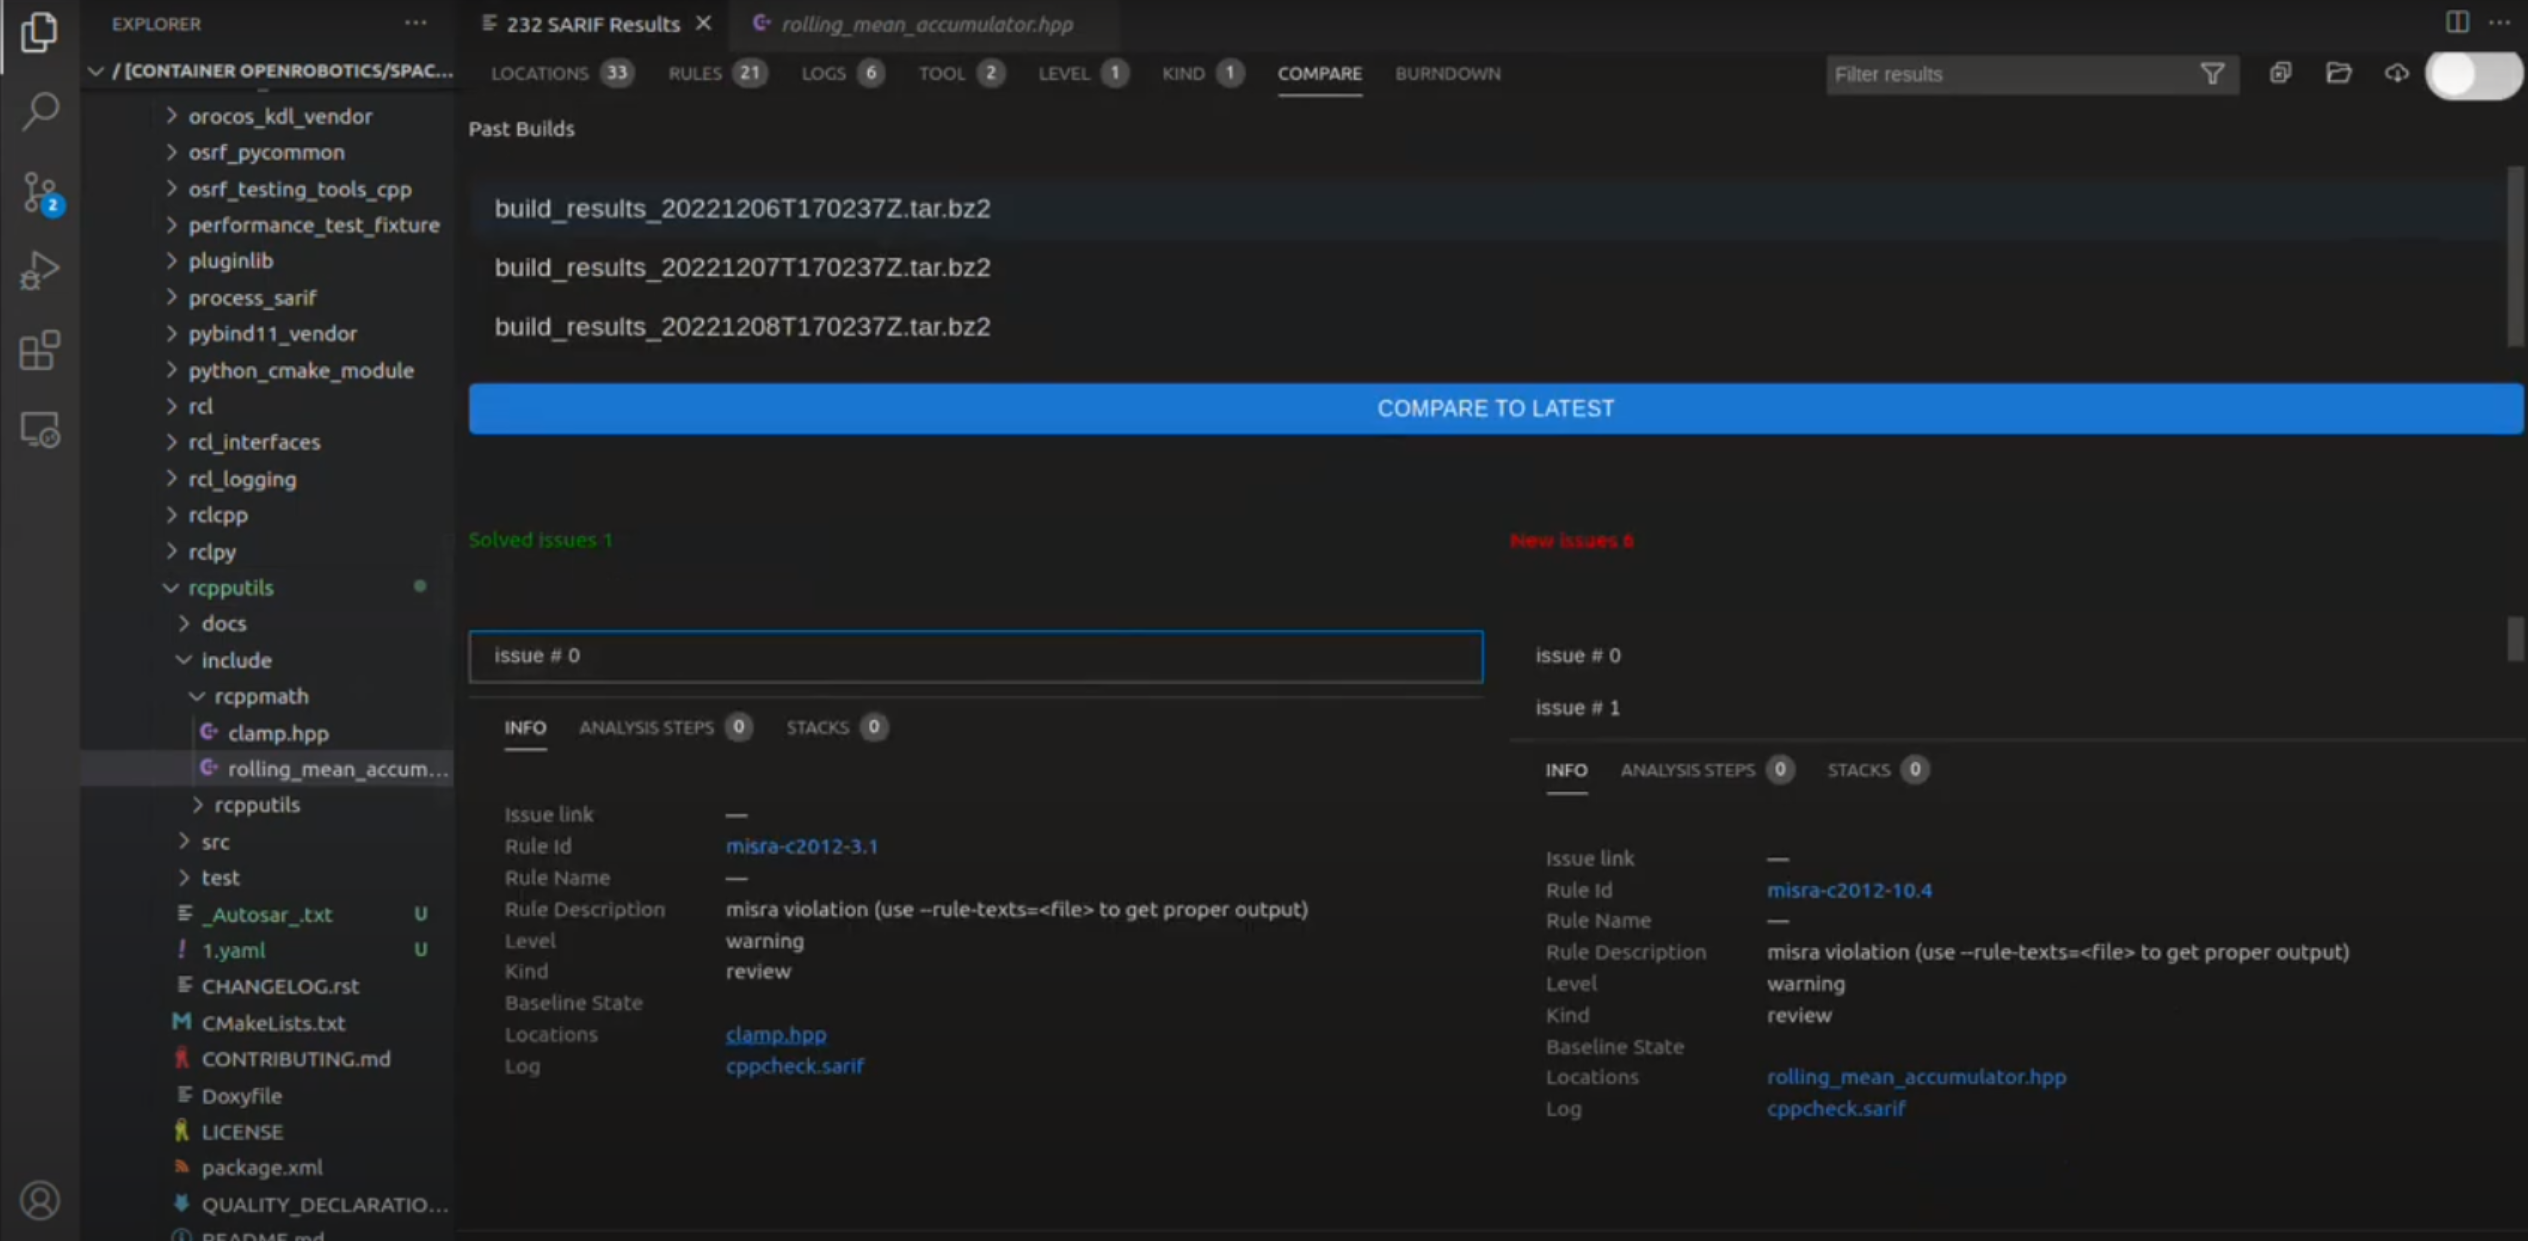
An example of comparing issues across builds.
Note
This is a work-in-progress and may not be available in the current release.
In the Space ROS Dashboard you are also able to compare issues across builds. To do this, you can open multiple SARIF build archives in the extension and click the “Compare” tab at the top of the panel. You are then able to select which builds you want to compare. You will see the issues that have been introduced or fixed between the builds you have selected.
Viewing a burn-down chart
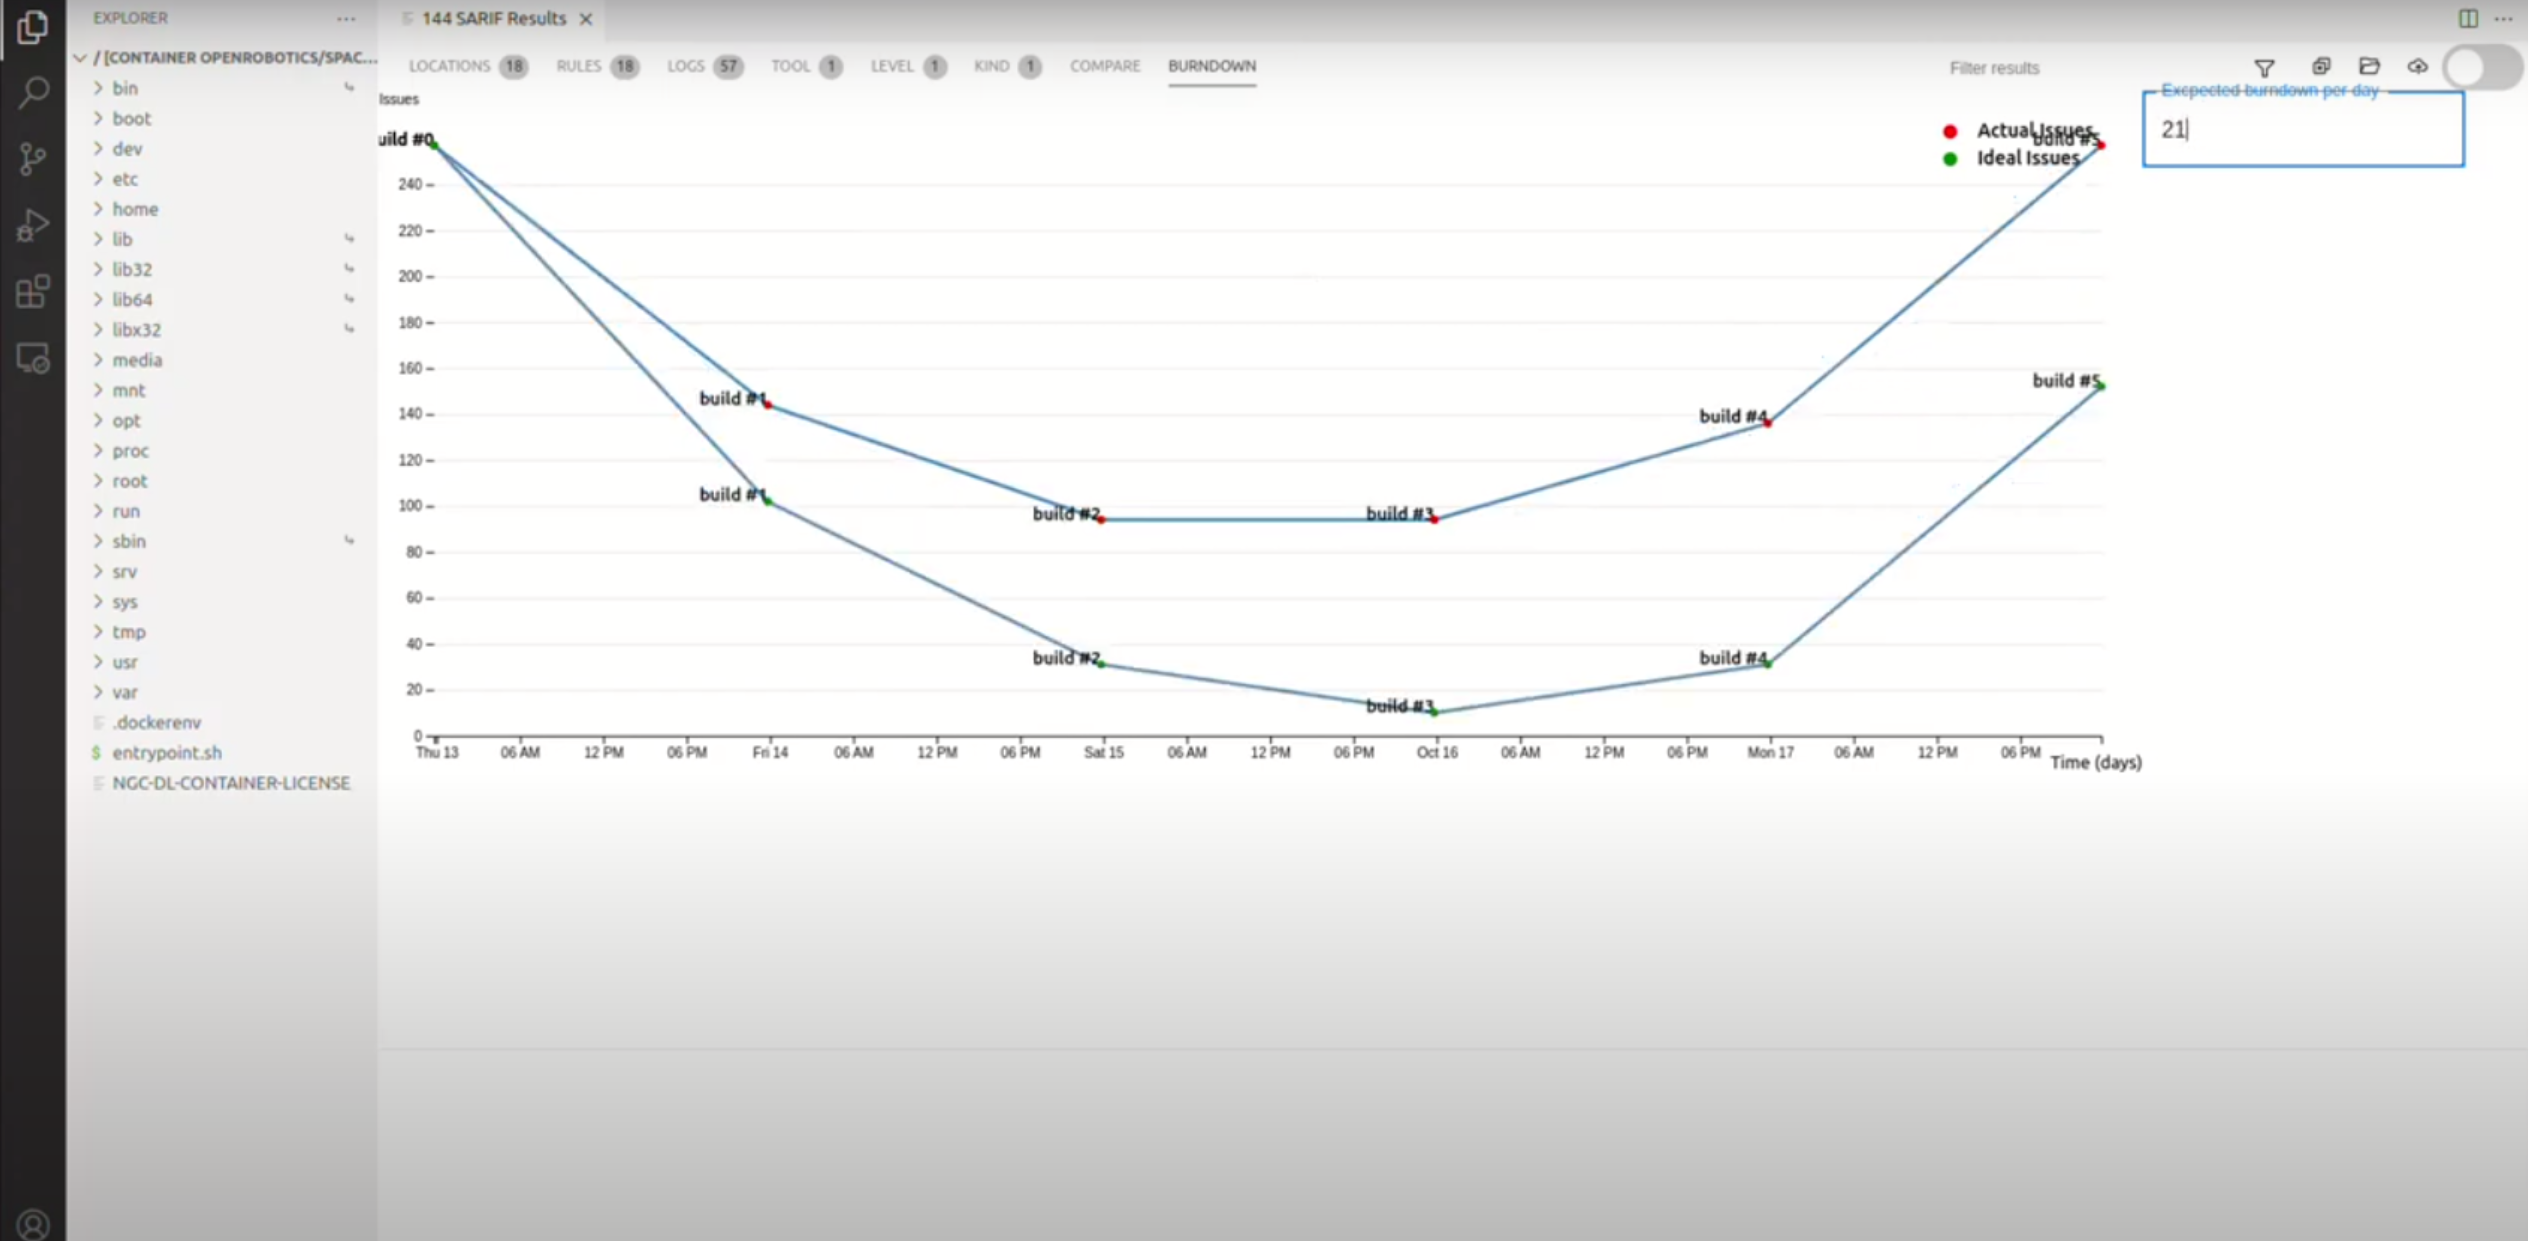
An example of a burn-down chart that shows the number of issues over time, given an expected rate of issue resolution.
Note
This is a work-in-progress and may not be available in the current release.
The Space ROS Dashboard also allows you to view a burn-down chart of issues over time. To do this, click the “Burndown” tab in the Space ROS Dashboard and input the expected rate of issue resolution. The burn-down chart will then show two lines: one for the expected rate of issue resolution and one for the actual rate of issue resolution.